Accounts Receivable Aging Report: How to Read It & Use It to Get Paid
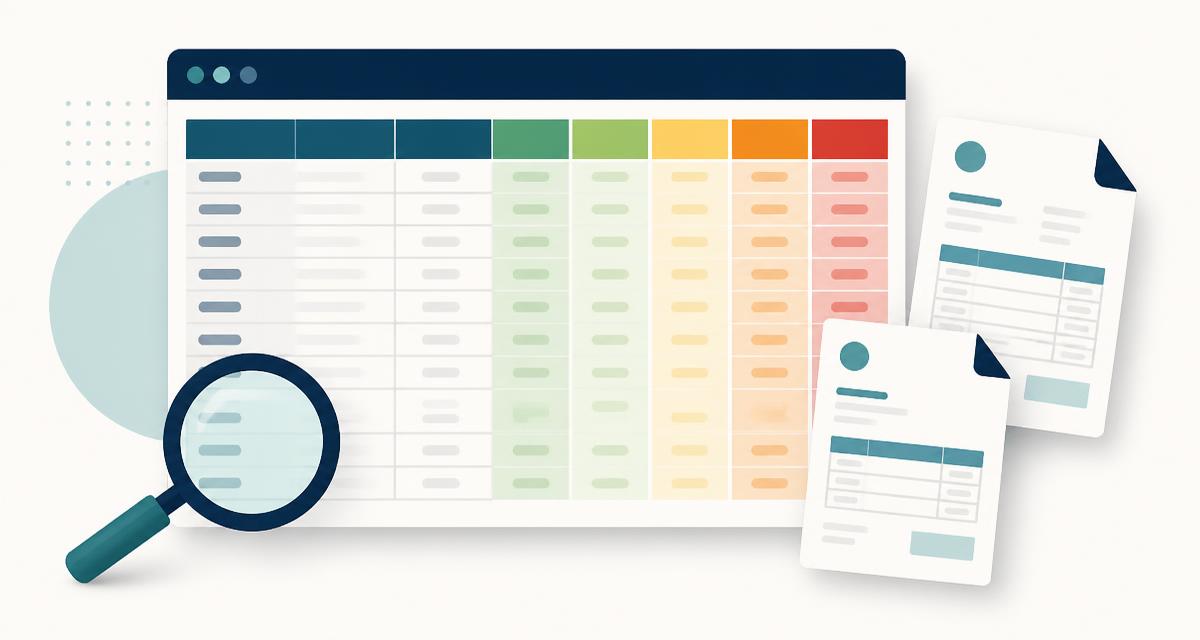
An accounts receivable aging report is the closest thing small businesses have to an X-ray of their cash flow. It takes every unpaid invoice you have issued and sorts it by how long it has been sitting there — current, 1–30 days late, 31–60, 61–90, 90+. Read correctly, it tells you which clients to chase today, which relationships are quietly turning into bad debt, and whether your billing process is working at all. This guide shows you how to build one, how to read it like a controller, and how to turn it into a weekly routine that measurably shortens the time between invoicing and getting paid.
Quick Answer: What Is an A/R Aging Report?
An accounts receivable aging report (also called an aging schedule or A/R aging summary) is a financial report that lists all unpaid customer invoices grouped into date ranges based on how many days they are past due. Standard buckets are Current, 1–30, 31–60, 61–90, and 90+ days. It is used to prioritise collections, estimate bad debt, and measure how healthy your receivables are. The higher the share of your balance sitting beyond 60 days, the more cash-flow risk you carry.
What an Aging Report Actually Shows
Your accounting software already knows the total you are owed. That single number is nearly useless on its own. $12,000 in receivables where every invoice was issued last week is a healthy business. The same $12,000 where two invoices have been outstanding for four months is a business about to have a very bad month.
The aging report solves this by adding the one dimension that matters: time. It answers three questions at a glance:
- Who owes me? Every customer with an open balance, listed by name.
- How much? The total per customer and per invoice.
- For how long? The age of each balance, measured from the invoice due date (or occasionally the invoice date — more on that below).
That third dimension is what turns a static balance into a prioritised action list. It is also the raw material behind every serious receivables metric, from DSO to your bad-debt allowance.
Aging report vs. aging schedule vs. A/R summary
These terms are used interchangeably in practice, with small differences:
- A/R aging summary — one row per customer, totals only. Best for a weekly review.
- A/R aging detail — one row per invoice. Best for actually chasing payment, because you need invoice numbers.
- Aging schedule — the accountant term, usually the summary version used for year-end provisioning.
You want both: the summary to see the shape of the problem, the detail to do something about it. See the A/R aging glossary entry for the short definition.
The Standard Aging Buckets (And What Each One Means)
Almost every accounting system uses 30-day buckets. What matters is knowing what each bucket is telling you, because the correct response is different for each one.

| Bucket | What it means | Typical collection rate | Right action |
|---|---|---|---|
| Current | Not yet due | ~98% | Nothing. Send a pre-due courtesy reminder 3 days out. |
| 1–30 days | Recently late — usually admin drift | ~93% | Polite automated reminder at day 1, 7 and 14. |
| 31–60 days | Something is wrong: dispute, missing PO, cash issue | ~85% | Pick up the phone. Confirm the invoice was received and approved. |
| 61–90 days | Serious risk — the client is choosing not to pay you | ~70% | Firm written notice, late fees, pause new work. |
| 90+ days | Likely bad debt | ~50% and falling fast | Payment plan, collections agency, or write-off. |
Collection rates vary by industry and country, but the shape of the curve is consistent everywhere: the probability of collecting falls sharply after 60 days and roughly halves again after six months. This is the entire argument for a systematic reminder process — every day of delay costs you real money, not just patience. Our 2026 late payment statistics post has the underlying data.
Should buckets run from invoice date or due date?
Both conventions exist and they produce very different reports.
- Due date aging (recommended) — an invoice only enters the 1–30 bucket once it is actually late. This is what you want for collections, because everything outside "Current" is an action item.
- Invoice date aging — used by some lenders and factoring companies, because it measures how long capital has been tied up regardless of terms.
If you bill Net 30 and use invoice-date aging, a perfectly on-time invoice appears in the "1–30 days" column, which makes the report look alarming and trains you to ignore it. Check which convention your software uses before you draw conclusions.
How to Build an A/R Aging Report (Step by Step)
You do not need accounting software to produce one. A spreadsheet works fine up to a few hundred invoices.
Step 1: List every open invoice
One row per unpaid invoice with these columns: customer name, invoice number, invoice date, due date, original amount, amount paid, balance outstanding.
Step 2: Calculate days past due
Days Past Due = Today's Date − Invoice Due DateIn Google Sheets or Excel: =TODAY()-D2 where D2 is the due date. A negative result means the invoice is still current.
Step 3: Assign each invoice to a bucket
=IFS(E2<=0,"Current", E2<=30,"1-30", E2<=60,"31-60", E2<=90,"61-90", TRUE,"90+")Step 4: Pivot by customer
Build a pivot table with customer as rows, bucket as columns, and the sum of the outstanding balance as values. That is your aging summary. Add a total row at the bottom and a total column on the right.
Step 5: Add the percentage row
Under the totals, express each bucket as a percentage of total receivables. This is the single most useful line in the whole report, and the one most people forget to add. It is what makes month-to-month comparison possible.
Step 6: Date it and archive it
An aging report is a snapshot, not a live document. Save a copy every month-end with the date in the filename. Three months of archived reports tell you far more than the latest one alone.
If you would rather skip the spreadsheet entirely, the AR Inbox in Can You Pay That maintains a live aging view of every sent and overdue invoice, grouped into exactly these buckets, with the reminder history attached to each case.
How to Read the Report Like a Controller
Most people look at an aging report and read the biggest number. A controller reads four things instead.
1. The shape, not the total
Healthy receivables are heavily weighted to the left. As a rough benchmark for a small B2B business billing Net 30:
| Bucket | Healthy | Watch | Problem |
|---|---|---|---|
| Current | 70%+ | 55–70% | Under 55% |
| 1–30 | Under 20% | 20–30% | Over 30% |
| 31–60 | Under 7% | 7–12% | Over 12% |
| 61–90 | Under 3% | 3–6% | Over 6% |
| 90+ | Under 2% | 2–5% | Over 5% |
2. Concentration risk
If one client represents more than 20–25% of your total receivables, your cash flow is not really yours — it belongs to their accounts payable department. Concentration is invisible in a revenue report and obvious in an aging report.
3. Movement between snapshots
Compare this month to last. Are balances moving right (aging) or being cleared? A total that stays flat while the mix shifts rightwards is the classic early signal of a collections problem, and it is completely invisible if you only ever look at the current month.
4. Repeat offenders
The same three client names appearing in the 60+ columns month after month is not a collections problem — it is a terms problem. Those clients need deposits, shorter terms, or milestone billing, which is a conversation for the next contract rather than the next reminder email.
Three Metrics to Calculate From Your Aging Report
Accounts Receivable Turnover Ratio
A/R Turnover = Net Credit Sales ÷ Average Accounts ReceivableHow many times per year you collect your average receivables balance. A ratio of 12 means you turn over receivables monthly. Higher is better. Divide 365 by the ratio to get DSO.
Days Sales Outstanding (DSO)
DSO = (Accounts Receivable ÷ Total Credit Sales) × Days in PeriodThe average number of days it takes to collect. Aim for no more than 1.25× your standard terms — so 37 days or under if you bill Net 30. Full worked examples and industry benchmarks are in the DSO guide.
Collection Effectiveness Index (CEI)
CEI = (Opening A/R + Credit Sales − Closing Total A/R) ÷ (Opening A/R + Credit Sales − Closing Current A/R) × 100CEI measures how much of what was collectable you actually collected, expressed as a percentage. Above 80% is good; above 90% is excellent. Unlike DSO, it is not distorted by a big sales month, which makes it the better metric for lumpy, project-based businesses.
Using the Report to Estimate Bad Debt
Under both GAAP and IFRS, you are expected to recognise the receivables you probably will not collect rather than carrying them at full value. The standard method is the aging method (also called the percentage-of-receivables method): apply an estimated uncollectible rate to each bucket.
| Bucket | Balance | Est. uncollectible | Allowance |
|---|---|---|---|
| Current | $40,000 | 1% | $400 |
| 1–30 | $12,000 | 3% | $360 |
| 31–60 | $6,000 | 10% | $600 |
| 61–90 | $3,000 | 25% | $750 |
| 90+ | $2,000 | 50% | $1,000 |
| Total | $63,000 | — | $3,110 |
The percentages should be based on your own history, not the illustrative figures above — look back two or three years and calculate what proportion of each bucket you eventually wrote off. Once an individual invoice is genuinely uncollectible, it becomes bad debt and is written off against the allowance. Talk to your accountant about the treatment in your jurisdiction, particularly around VAT or sales-tax relief on written-off invoices.
Turn the Report Into a Weekly 20-Minute Routine
A report you read but never act on is worse than no report, because it creates the feeling of control without the substance. Here is a routine that fits into twenty minutes a week.
Monday, 20 minutes
- Pull the aging detail report (2 min). Same day, same time, every week.
- Clear the 1–30 column with automation (0 min). These should already be handled by scheduled reminders — see the reminder schedule builder for a cadence that works.
- Work the 31–60 column (10 min). One personal email or call each. The goal is not payment, it is a commitment: a specific date and a named person. Use the reminder email generator if you need wording that stays firm without burning the relationship.
- Escalate the 61–90 column (5 min). Final notice, late fee applied, work paused. Our pause-work email template covers the exact wording.
- Decide on the 90+ column (3 min). Payment plan, agency, or write-off. Not "chase again next week" for the ninth time.
Monthly, 15 minutes
- Archive the month-end snapshot.
- Recalculate DSO and the bucket percentages; chart them over time.
- Flag any client with two consecutive months in the 60+ columns for a terms review.
The compounding effect matters more than any single week. Businesses that move from ad-hoc chasing to a fixed weekly cadence typically pull 10–20 days out of their DSO within a quarter, mostly by preventing invoices from ever reaching the 60+ buckets in the first place.
Fix the Causes, Not Just the Symptoms
Aging is a lagging indicator. If your 31–60 bucket keeps refilling, the fix is upstream of collections:
- Invoice the same day the work completes. Every day of billing delay is a day of aging you added yourself.
- Make sure the invoice is payable. A missing PO number, wrong contact, or absent bank details converts into 30 days of aging silently. Run through the invoice requirements checklist.
- Number invoices consistently so clients can reference them in their AP system — see the invoice numbering guide.
- Add one-click payment. Card and bank links measurably shorten payment time versus bank-transfer-only invoices. Our guide to accepting credit card payments on invoices covers the trade-offs.
- Collect onboarding details before the first invoice using a vendor onboarding checklist.
- Automate the first three reminders so the polite chasing happens without you deciding to do it. See automatic invoice reminders.
Six Common Aging Report Mistakes
- Reading the total instead of the mix. The distribution is the report; the total is just context.
- Never comparing snapshots. One report is a photo. Six are a trend, and trends are where the decisions live.
- Ageing from invoice date while billing on terms. Makes every on-time invoice look late and destroys the report's usefulness.
- Leaving credit notes and unapplied payments in the report. They create phantom balances that make you chase clients who already paid — the fastest way to damage a good relationship.
- Treating 90+ as still active. After 90 days you are not collecting, you are hoping. Decide: plan, agency, or write-off.
- Doing it monthly. Monthly review means an invoice can be 45 days late before anyone looks at it. Weekly is the minimum useful cadence.
Where to Find the Report in Common Tools
| Tool | Path |
|---|---|
| QuickBooks Online | Reports → Who owes you → A/R Aging Summary / Detail |
| Xero | Accounting → Reports → Aged Receivables Summary |
| FreshBooks | Reports → Accounts Aging |
| Wave | Reports → Aged Receivables |
| Zoho Books | Reports → Receivables → AR Aging Summary |
| Can You Pay That | AR Inbox — live aging buckets with reminder history per case |
If you already run Xero or QuickBooks, our comparisons of Xero vs. QuickBooks for invoicing and Xero invoice reminders explain what each one can and cannot automate around aging.
Frequently Asked Questions
What is an accounts receivable aging report?
It is a report that lists all unpaid customer invoices grouped by how long they have been outstanding, typically in Current, 1–30, 31–60, 61–90 and 90+ day buckets. It is used to prioritise collections, spot credit risk, and estimate bad debt.
How often should I run an aging report?
Weekly for collections and monthly for reporting. Weekly review means no invoice sits unnoticed for more than seven days; the month-end snapshot is what you archive and trend.
What is a good accounts receivable aging percentage?
For a small B2B business on Net 30 terms, roughly 70%+ of the balance should be current, under 20% in 1–30 days, and under 5% beyond 60 days. Anything above 5% in the 90+ bucket usually signals a structural collections problem.
Should aging be calculated from the invoice date or the due date?
Use the due date for collections, so that anything outside the Current bucket is genuinely late and actionable. Invoice-date aging is mainly used by lenders and factoring companies measuring how long capital is tied up.
What is the difference between an aging report and a DSO calculation?
The aging report shows the distribution of unpaid invoices across time buckets at a point in time. DSO condenses that into a single average number of days to collect. The report tells you which invoices to chase; DSO tells you whether your process is improving.
How do I calculate bad debt from an aging report?
Apply a historical uncollectible percentage to each bucket and sum the results. For example 1% of Current, 3% of 1–30, 10% of 31–60, 25% of 61–90 and 50% of 90+. Base the percentages on your own write-off history rather than generic figures.
Can I create an aging report in Excel or Google Sheets?
Yes. List each open invoice with its due date and balance, calculate days past due with =TODAY()-due_date, assign a bucket with an IFS formula, then pivot by customer. This is perfectly adequate up to a few hundred open invoices.
What should I do with invoices over 90 days old?
Stop sending routine reminders and make a decision: negotiate a written payment plan, hand it to a collections agency, pursue small-claims or statutory late-payment interest, or write it off and stop spending time on it. Continuing to chase without escalating rarely changes the outcome.
Does the aging report include credit notes and deposits?
It should, as negative balances offset against the customer. Unapplied credits and unallocated payments are the most common cause of a client appearing overdue when they have actually paid, so reconcile them before you send reminders.
What is an aging schedule?
An aging schedule is the same thing as an aging report, usually referring to the summarised customer-level version accountants use at period end to calculate the allowance for doubtful accounts.
The Bottom Line
An accounts receivable aging report is not a bookkeeping formality — it is a prioritised list of the cash you have already earned but do not yet have. Pull it weekly, read the distribution rather than the total, act on the 31–60 column before it becomes the 61–90 column, and fix the upstream causes that keep refilling it. Most small businesses find that the aging report alone, worked consistently for one quarter, does more for cash flow than any change to pricing or sales.
Can You Pay That builds the aging view for you and automates the reminder sequence behind each bucket, so the weekly routine takes minutes instead of an afternoon. You can also start with the free collections tools — no account required.
Related reading: Outstanding invoices explained, A/R best practices, and the invoicing glossary. External reference: the Investopedia definition of aging and the SBA guidance on managing business finances. Last reviewed: 2026.